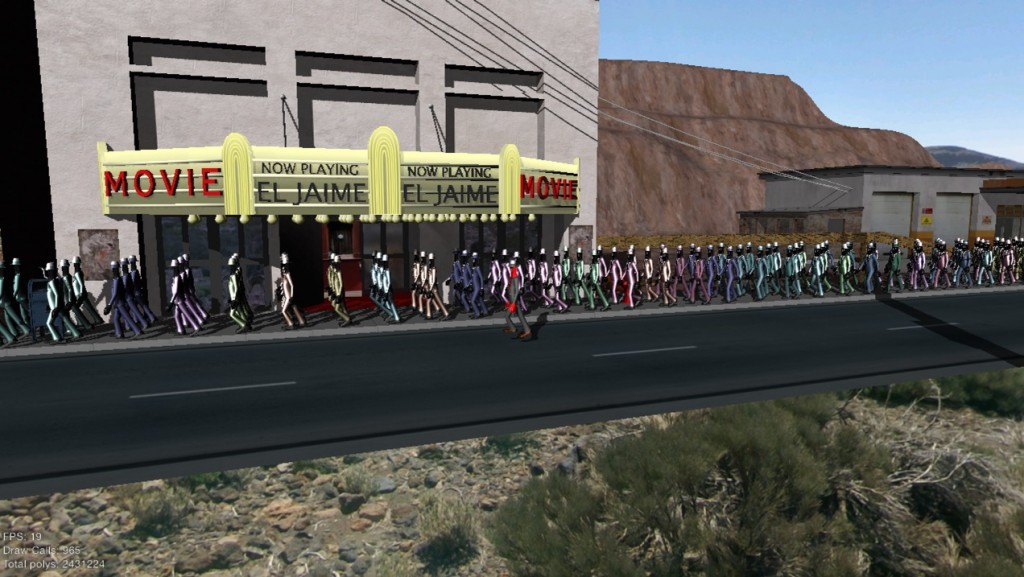
[QUOTE=mlfarrell;1262212]Been working on my graphics engine heavily over the past couple weeks to try to get my performance up. I wanted to post this screenshot including rendering statistics in the lower left hand corner to ask you guys whether or not this is about “par for the course” with respect to the number of draw calls I’m issuing and the number of polygons I’m trying to render. I tried implementing instanced rendering only to find that the performance actually didn’t increase at all, leading me to believe that the bottleneck here is the number of polygons I’m trying to render?
My graphics hardware is a Geforce 650m (retina MBP on OSX) at a 1280x720 resolution with vsync on.[/QUOTE]
First, if you’re trying to benchmark, turn sync-to-vblank off and render as fast as possible. The reason is sync-to-vblank typically imposes an arbitrary “stall” in your timings that messes up your timings. Also, if you’re running through a compositing window manager (Aero/DWM/etc.), turn it off so you can render and swap as fast as possible.
Put a glFinish after swapbuffers, and time from after glFinish from the previous frame to after glFinish of the next frame. If your frame time is quite a bit faster than your target vsync interval (e.g. 16.666ms for a 60Hz LCD), then congrats! You’re done optimizing!
If OTOH it’s not, or you’re just not happy with it and want to see what you can do to make it render even faster, then you need to determine what your primary bottleneck is. Note that you can/probably are bottlenecked on different things during the course of your frame, but you’re trying to size up what the most significant bottleneck is.
Try resizing your window a little around your target resolution (but rendering the same subfrustum into the world). So same triangles and state changes, just more pixels. If your frame time changes, you may be fill bound.
As to whether you may be triangle bound, I don’t know if NVidia’s mobile GeForce GPUs are like the desktop GeForces, but on the latter generally speaking (if you’re not using hardware tessellations), the GPUs can pump out at most 1 triangle per GPU core clock cycle. There you take your core clock rate, divide 1000, and that’s the max tris you can expect to generate per millisecond (ms) of draw time. If you’re pretty close to this number, you may be triangle setup bound.
If you’re making lots of state changes and/or draw calls, suspect that you might be CPU bound. “A lot” depends on the hardware you’re running on, and how fast the CPU is relative to the GPU.
If you have access to it, use a vendor profiling tool like NVidia NSight. This will likely accelerate your analysis.
