Dear all, I have googled and tried many things. Right now I am stuck and looking for suggestions, ideas on where to look further.
I am looking for a strategy to automatically determine the support/resistance (S/R) levels in a graphical price chart.
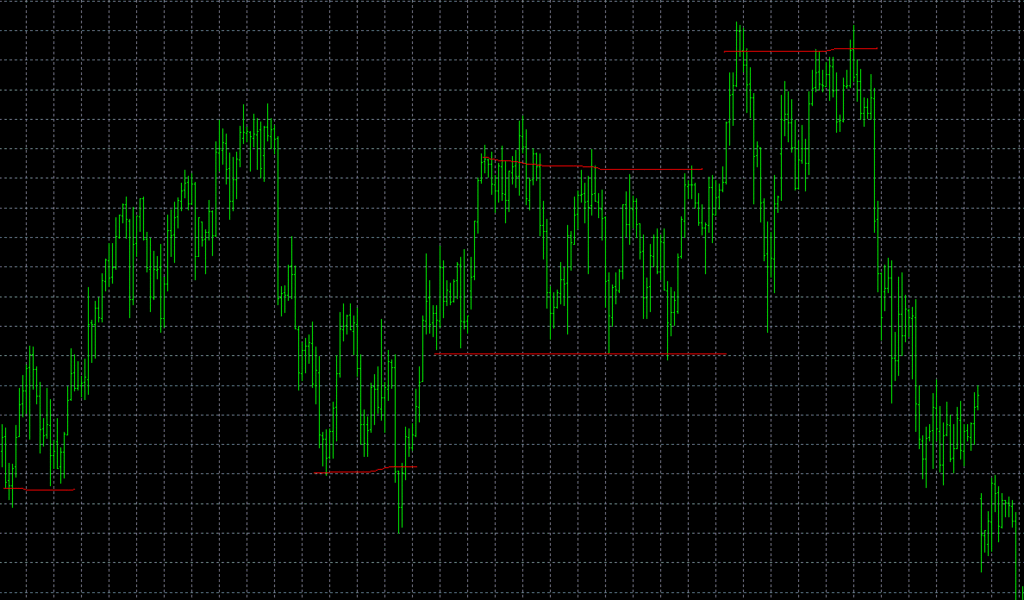
Please see picture. The S/R lines is an example of what I like to achieve.
To simplify matter are horizontal S/R lines fully sufficient.
I have tried to find a line with the smallest square error. But ultimately, who to determine, which data points shall belong to which S/R line.
Further I have tried k-means clustering to somehow cleverly group data points to their S/R line with the shortest distance. But it clusters data points more around a radius than along a line.
For this type of thing the important consideration is that the points in the graph are generated at different points in time. All points are not equal, the graph really does start at the left and go to the right. Things that you tried like least squares ignore this fact and so offer no hope in providing the answer. Here is one method to generate an s/r line.
1.) Pick a minimum time step (I don’t know what would be reasonable for the economics world.)
2.) A s/r line exists where price levels are relatively unchanged (in some sense) for at least the minimum time step.
3.) Start at the left end of the plot, and sequentially determine if each point is the start of an s/r line, and if so, the extent of the line.
Notice that this is a sequential method, you can’t consider all points simultaneously. Also, picking a reasonable time step is critical.