We would like to give you an update about the most recent developments in gDEBugger. We hope you will find this information valuable, as always. We would be glad to hear your feedback / comment on these develoments.
Here are some of gDEBugger’s latest features:
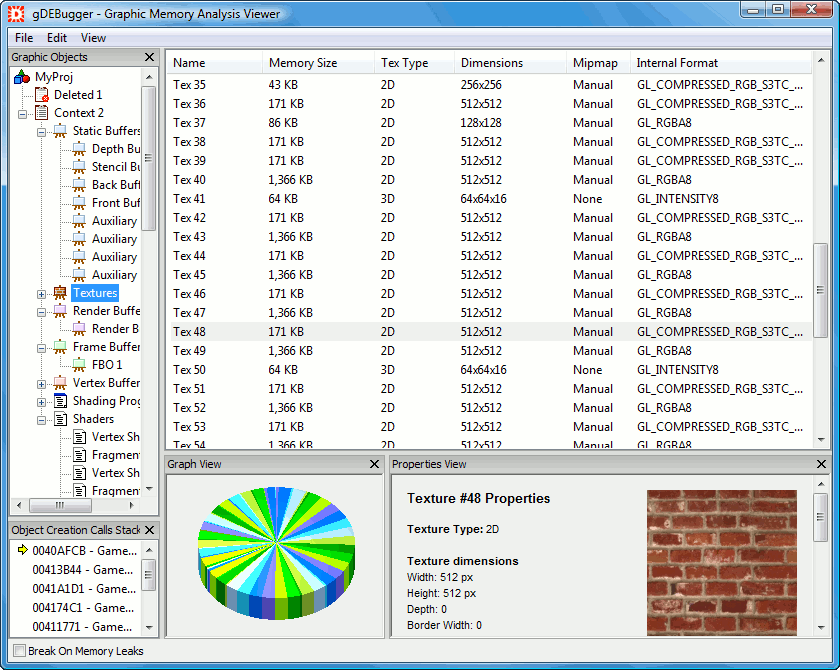
Graphic Memory Analysis viewer
The Graphic Memory Analysis viewer displays information about graphic memory leaks and graphic memory allocated objects. With the Graphic Objects Application Tree view you can browse the allocated objects quickly by their render context and type. The objects’ details can be viewed in the Graphic Object Details list as well as the Properties view.
Use the Object Creation Calls to see the scenario that led to each object’s creation. Turning on the “Break on Memory Leaks” option will let you see which allocated objects are not cleared properly by your application.
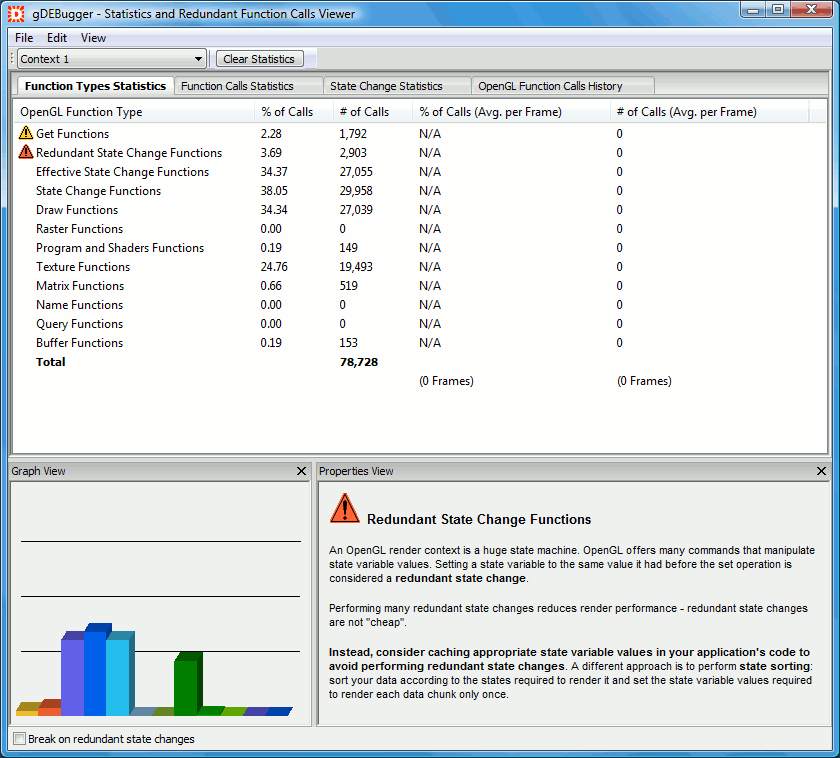
Statistics and Redundant State Changes viewer
The Statistics and Redundant Function Calls viewer displays an in-depth statistical analysis of your application’s OpenGL usage.
In the Function Types Statistics view, you can view a breakdown of your application’s OpenGL usage to categories by functions’ effects and actions.
Looking at the Function Calls Statistics view, you will be presented with a breakdown of the OpenGL usage on an individual function basis, as well as warnings and recommendations about unrecommended function calls.
In the State Change Statistics view you can see the information collected by gDEBugger’s Analyze Mode on the effectiveness of OpenGL state change functions.<br>This viewer also contains the OpenGL Function Calls History view, allowing you to view the actions surrounding each of the unneeded OpenGL function calls.
gDEBugger Tutorial
The new gDEBugger Tutorial supplies all the information needed to start working with gDEBugger; installation and project creation, basic functionality and a great number of tasks that can be performed with gDEBugger.
The tutorial explains, in clear and simple language illustrated by screenshots, how to make use of gDEBugger’s features to their full extent, whether the task is general as cleaning up OpenGL usage or more advanced as locating graphic pipeline bottlenecks or redundant state change function calls.
The gDEBugger tutorial is available for online viewing here, and is also included with the latest release of gDEBugger.
Download gDEBugger and get a FREE 30-day trial license to try out all of gDEBugger’s great features!
Windows download
Linux download
Any feedback will be appreciated at: support [at] gremedy [dot] com
Regards,
The gDEBugger team

